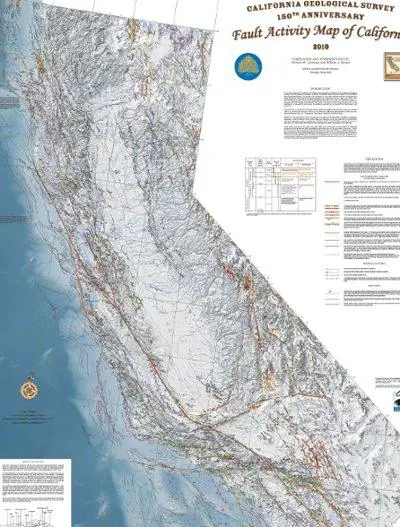
The 2010 Fault Activity Map of California was released in April 2010 and is the first all-digital statewide fault map. Courtesy of the California Geological Survey.
LAKE COUNTY – A map released this spring tracks all of California faults – the earthquake variety, that is.
The California Geological Survey's 2010 Fault Activity Map of California marks the survey's 150th anniversary.
It's based on maps compiled by Charles Jennings published in 1977 and 1994, but it's different in an important way, according to Chris Wills, supervising engineering geologist.
“It's an all-digital project,” said Wills, explaining that the map's previous version in 1994 was drawn on a printer's plate, which can't show as much detail.
A number of the California Geological Survey's maps over the last 10 years have been fully digital, but this was the first fully digital statewide map, he said.
“For this version we went back to all the original sources” for all of the faults, he said.
Wills said the California Geological Survey also works with the US Geological Survey, sharing information about fault activity and compiling fault activity rates that area used for the US Geological Survey's national seismic hazard maps. Those maps, in turn, are used in developing building codes.
He said the new state fault map shows the faults that criss-cross California in more precise detail and location that before. The map quality is done at a 1 to 750,000 scale, with one inch equaling 12 miles.
“The best thing about this map is there's a lot more capability here than there was before,” said Wills, explaining that a couple hundred faults have been updated on the map, with some added and even some deleted.
Wills said there were many “bedrock” faults that have since broken the surface and become active. A big earthquake in the Southern California desert in 1999 ruptured just such a fault that hadn't been known.
Quakes are classified according to how recently they offset the ground surface, said Wills. Faults classified as active have been active since the last ice age.
The quaternary period is the most recent in the geologic time scale, spanning the last two million years. “Almost everything we call soil has been deposited in the last two million years,” he said, with deposits coming from the ice ages.
The map color codes the faults. Wills said if they've been active in the last few millions years, or the early quaternary period, they're purple, while late quaternary period, from 11,700 to 700,000 years from the present, are green. Both of those time frames belong to the Pleistocene epoch.
More recent late quaternary periods, including the Holocene epoch, from 11,700 years ago to 200 years ago, are marked in orange, with the historic period – 200 years ago to the present day – denoted in red, according to the map legend.
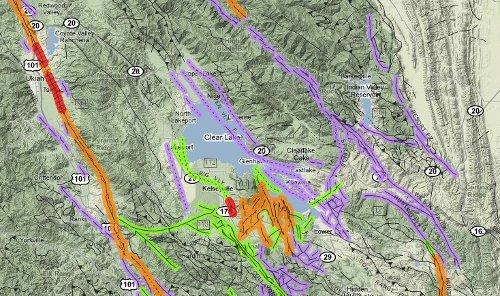
A closeup of the Lake County area from the 2010 Fault Activity Map of California. Courtesy of the California Geological Survey.
The map shows the Lake County area has several faults from the early quaternary period, noted in purple, which follow the Northshore of the lake or run parallel to it.
They include the Clover Valley fault line, Hunting, Hunting Creek, Ellis and Wilson faults, the Resort fault to the east of Indian Valley Reservoir and the long Bartlett Springs fault line, which runs along Lake Pillsbury, which recently has seen some increased seismic activity, as Lake County News has reported.
On the other side of the lake there is the Big Valley fault, denoted in green, originating in the late quaternary period, with one portion of it marked in red, showing that displacement has occurred within the last 200 years, according to the map explanation.
In the seismically busy Geysers geothermal steamfield area, there are a number of unnamed faults from the Holocene epoch – marked in orange – and early quaternary period lines in purple.
Also coming from the late quaternary period is the Collayomi fault, which runs through the Middletown and Cobb areas.
“In the Clear Lake area there aren't a lot of new faults,” but there are more detailed lines included in the map now, said Wills.
He said the volcanic deposits in the Lake County area are between one and two millions years old, and almost all of the faults now illustrated on the county's portion of the map were on the 1994 fault map.
Will said The Geysers area has a high natural rate of earthquakes, plus whatever is being added to it through geothermal production.
He said The Geysers always is the source of small earthquakes because it's a shallow magma body.
Lake County isn't quite as active seismically as places in Humboldt County, Cape Mendocino or even Imperial County, which this spring was dominating the state for aftershocks from larger quakes, Wills said.
Some regional faults have shown recent dramatic changes, such as the Maacama fault, which has broken pavement in the driveway of the Willits Safeway, he said.
A few of the newly recognized faults are in the Sierras, he said, with new active faults found in the Lake Tahoe area.
Wills said they include the Polaris fault east of Truckee and the West Tahoe fault that runs into the lake and comes on shore near Emerald Bay before moving south. In the southern Sierra there is the Kern Canyon fault.
“It's a generalization to say that the more recent faults have the most earthquake hazard near them, but that's not far off,” he said.
The larger active faults have the majority of the earthquake hazard, and Wills said the map gives a good idea of where the hazards are.
San Andreas continues to evolve
Then, there is the San Andreas fault, perhaps the state's best known.
The map shows the fault running in an ominous blood red line from Southern California all the way up to Cape Mendocino, where it disappears into the Pacific Ocean.
The northern portion of the San Andreas fault, which Wills said runs from San Juan Bautista northward, includes the epicenter of the devastating 1906 San Francisco earthquake, which caused a rupture of the fault.
A portion of the fault north of Mendocino and noted in purple is believed to have resulted from the 1906 quake, however, Wills noted, “The data is not all that clear.”
From San Juan Bautista south to Parkfield, Will said the San Andreas is a “creeping” fault, meaning there is constant slow movement of it.
South of Parkfield down to San Bernardino is the San Andreas' 1857 rupture, which he said is the same size as the rupture from 1906, “but it was only 50 years earlier,” said Wills. Faults usually don't have that many major ruptures in such a short period of time.
There also were big quakes along the fault in 1838 in San Francisco and 1812 in Southern California, Wills said.
Wills said the San Andreas fault has the most slip between the North American and Pacific plates. The Pacific plate is moving northwest at almost 40 millimeters a year. “Over 20 of that is on the San Andreas itself,” he said.
North of Cape Mendocino, “You cross into a whole different plate boundary,” said Wills.
Near the mid-ocean ridge where the ocean floor is being created is the area known as the Gorda plate, and it's close to where the big quakes happened off of the coast of Eureka earlier this year, he said.
He said the Gorda plate is being pushed underneath the continent on the Cascadia subduction zone. “That's the zone where you can have very large earthquakes,” he said.
Farther north is the Juan de Fuca plate, which was the site of the Cascadia earthquake, measuring around magnitude 9, which occurred in January of 1700, Wills said. It's an active fault but geologists aren't sure of the fault's actual route.
The Cascadia quake caused tsunamis on the coast of California, Oregon and Washington, he said.
“That geologic evidence gets preserved in some of these bays all up and down the coast,” Wills said.
Wills said salt marsh and edges of freshwater marshes suddenly subsided below sea level.
The Cascadia earthquake was similar to the 8.8-magnitude earthquake that hit Chile last February, he said. “The tsunamis that came on shore there were devastating.”
An anthropologist who was the wife of a Humboldt State geologist studied the Cascadia quake based on American Indian stories of the time, and Wills said she found stories of a “long shaking” in the middle of a winter night.
Already out of date
Shortly after the map was released in April it already was out of date, said Wills.
An earthquake in early April in Baja caused surface faults, he said. “We have historic surface breakage on a number of faults that we didn't before.”
It probably will be a decade before another comprehensive update of the map is completed, but Wills said it will not require as much work next time, and the technology may allow them to conduct updates more frequently.
Much of the work for the new map was done by senior geologist Bill Bryant and student assistants, said Wills.
Wills said they've had a “surprising amount of interest” in the map.
“I think people are primed to care about earthquakes right now,” he said, especially in light of large and highly destructive earthquakes around California and the world this year.
To see the map in detail, visit www.quake.ca.gov/gmaps/FAM/faultactivitymap.html.
E-mail Elizabeth Larson at This email address is being protected from spambots. You need JavaScript enabled to view it. . Follow Lake County News on Twitter at http://twitter.com/LakeCoNews and on Facebook at http://www.facebook.com/pages/Lake-County-News/143156775604?ref=mf .


