- Peter Mateyka and Wan He
- Posted On
People ages 65 and older with disabilities change residences more often but move shorter distances
Most move within their counties, either to downsize or because they need housing (like one-story or assisted living facilities) to accommodate changes in their health and disability status.
A new U.S. Census Bureau report uses data from the Census Bureau’s 2015-2019 American Community Survey (ACS) to show the number and characteristics of older U.S. adults who moved and how far they moved. The ACS collects data on where people currently live and where they lived in the prior year and on their disability status.
In addition to the moving patterns of older adults, the report also looks at how disabilities affect their likelihood of changing locations. This month is the 77th anniversary of National Disability Employment Awareness Month.
Impact of disability on migration
Individuals may experience disability if they have difficulty doing certain daily tasks due to a physical, mental or emotional condition. The ACS considers someone to have a disability if they reported vision, hearing, cognitive, ambulatory, self-care or independent living difficulty.
Annually, during the 2015-2019 period, about 18.2 million older people, or about 36.0% of people ages 65 and older, reported at least one disability.
A disability may create a mismatch between a person’s housing needs and their current housing situation, necessitating a move to a new residence.
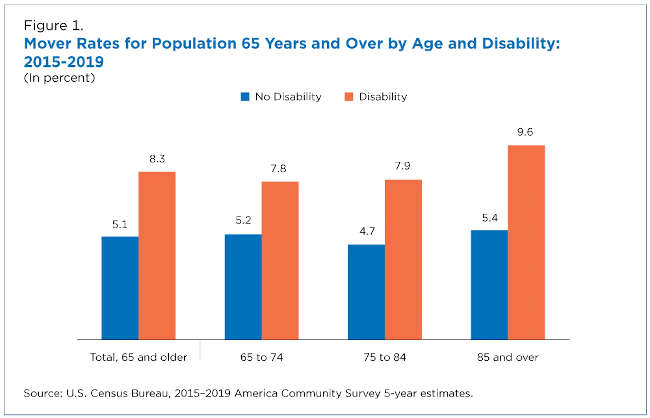
Older people with at least one disability were more likely to move (8.3%) than older people without a disability (5.1%).
However, older adults with disabilities made more short-distance moves and fewer long-distance moves than those without a disability. Of those who moved, 61.8% of those with a disability stayed in the same county compared to 54.6% of older movers without a disability.
About 240,000 older adults with a disability made interstate moves.
Out of the four U.S. regions, the South had the largest net migration gain (17,500) among older movers with a disability in a typical year during the 2015-2019 period. The net number of movers from the West was not statistically significant from zero, while the Northeast (11,500) and Midwest (7,400) both had net losses.
Florida had a net gain of about 9,730 people with a disability. Both Texas (about 4,780) and Arizona (about 4,390) also had net gains of at least 3,000 people with a disability.
Do most older adults migrate short distances?
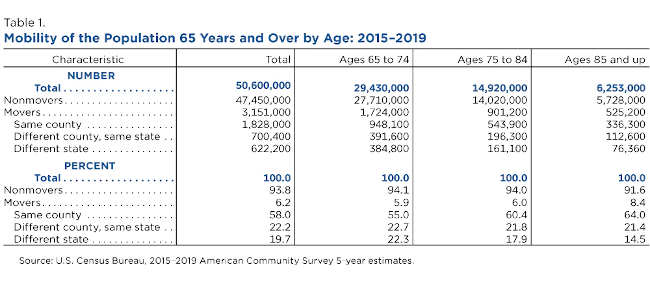
Only about 6.2% of adults ages 65 and over (over 3 million) moved during the prior year in a typical year during 2015-2019. People ages 85 and over were slightly more likely to move than those ages 65 to 74 and 75 to 84.
Most older movers stayed in the same county – about 58% – while only 19.7% or 620,000 moved to another state annually during the 2015 to 2019 period.
What regions draw older adults?
The South had the largest net migration gain (more moving in than out) of older people of any region: about 72,900 during a typical year in 2015-2019.
This far outpaced the West, which had a net gain of about 8,800 older people from migration.
The Northeast and Midwest both had net losses in the number of older adults from migration: a loss of about 46,800 and 34,900 respectively.
These patterns echo longstanding trends of older adults moving out of the Northeast and Midwest to the South and West. Some make these long-distance retirement moves to warmer climates and amenities-rich areas. However, the states they choose to move to within these regions vary substantially.
What states gained most older movers?
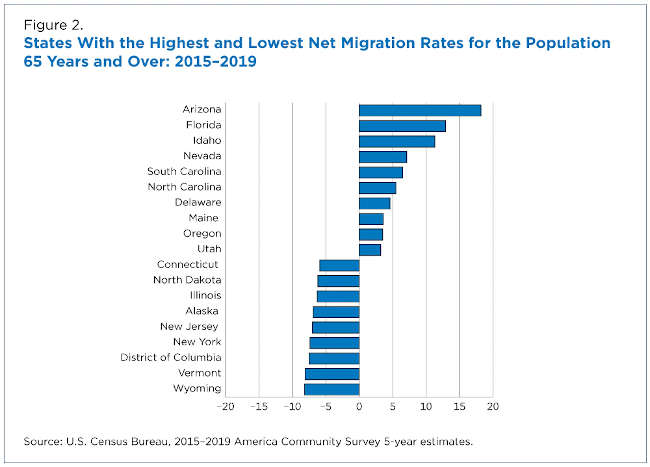
Florida gained more older adults from net migration than any other state: 53,150 annually during the 2015-2019 period. This was more than twice the 21,440 older people that Arizona added.
New York had larger net losses (23,420 people 65 and older) annually during the period from domestic migration than any other state. And California had the second-largest net loss (19,200) of any state.
The net migration rate gives a better sense of the size of the influx relative to a state’s population. The reason: it calculates the net number, in this case of older adults, added to a state from migration per 1,000 people living in the state.
By that measure, Arizona had the highest net migration rate at 18.2. Florida and Idaho were also among the highest of any states in the nation with rates of 12.9 and 11.3, respectively.
Where did older movers come from?
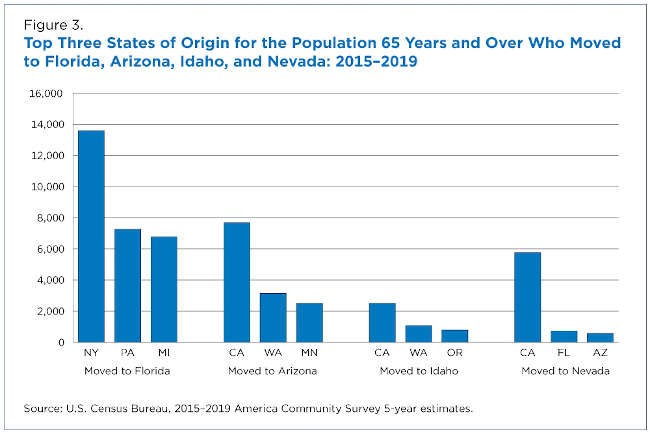
State-to-state migration flows illustrate the geographic origin and destination of people moving across state boundaries.
Many older adults who moved to Florida during 2015 to 2019 came from New York, Pennsylvania, and Michigan.
For Arizona, Idaho, and Nevada, the highest inflows came from nearby California, Washington, and Oregon.
This research was supported in part by the National Institute on Aging.
Peter Mateyka is a statistician in the Housing Statistics Branch of Census Bureau’s Social, Economic, and Housing Statistics Division. Wan He is director of the Aging Research Program in the Census Bureau’s Population Division.
